3. Scientific web validation
3.1. Tree structure of scientific validation
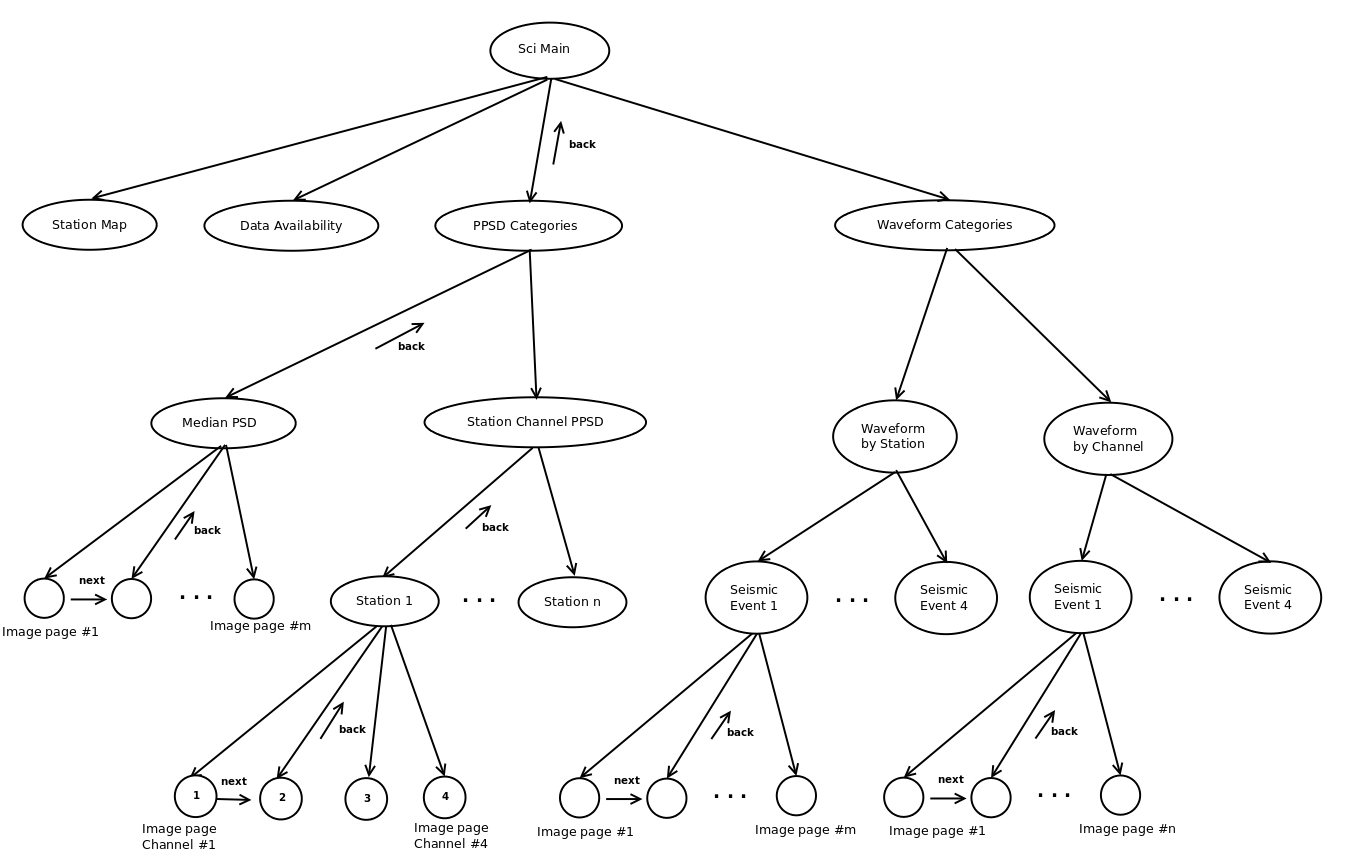
Fig. 3.1.1 Scientific validation tree structure
The scientific validation (figure Fig. 3.1.1) shares the Station Map and Data Availability pages with the Technical validation. The PPSD categories node page is an entry point to validate PPSDs (Probabilistic Power Spectral Densities), by selecting one of 2 sub-categories: median PSD and station channel PPSD. Through the median PSD node page, a number of image pages, one plot for each unique channel name, can be reached. The station channel PPSD node page gives access a PPSD for every channel of every station. Waveform plots allow the auditor to compare arrival times and amplitudes within a station (Waveform by Station) and between channels with the same name (Waveform by Channel).
3.2. Example of scientific validation pages
3.2.1. Main page
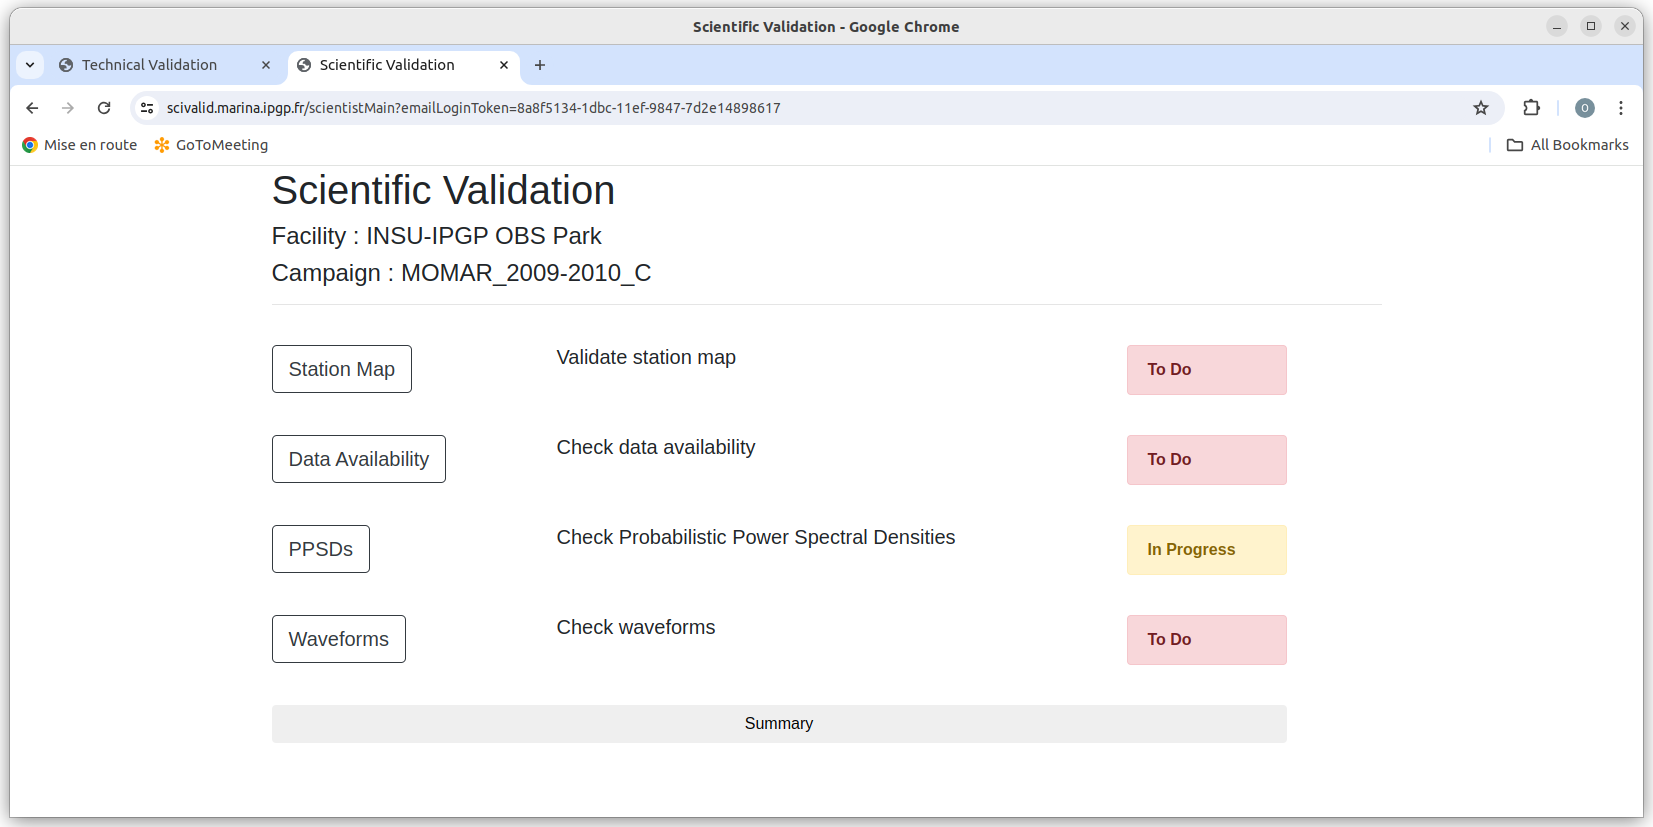
Fig. 3.2.1 Main page of scientific validation
The main page of the scientific validation contains a Station Map button to move to the Station map page, and Data availability button, to go to the Data availability page, the PPSDs button to go to the PPSD Categories and the Waveforms buttons to move to the Waveform categories.
3.2.2. PPSD Categories
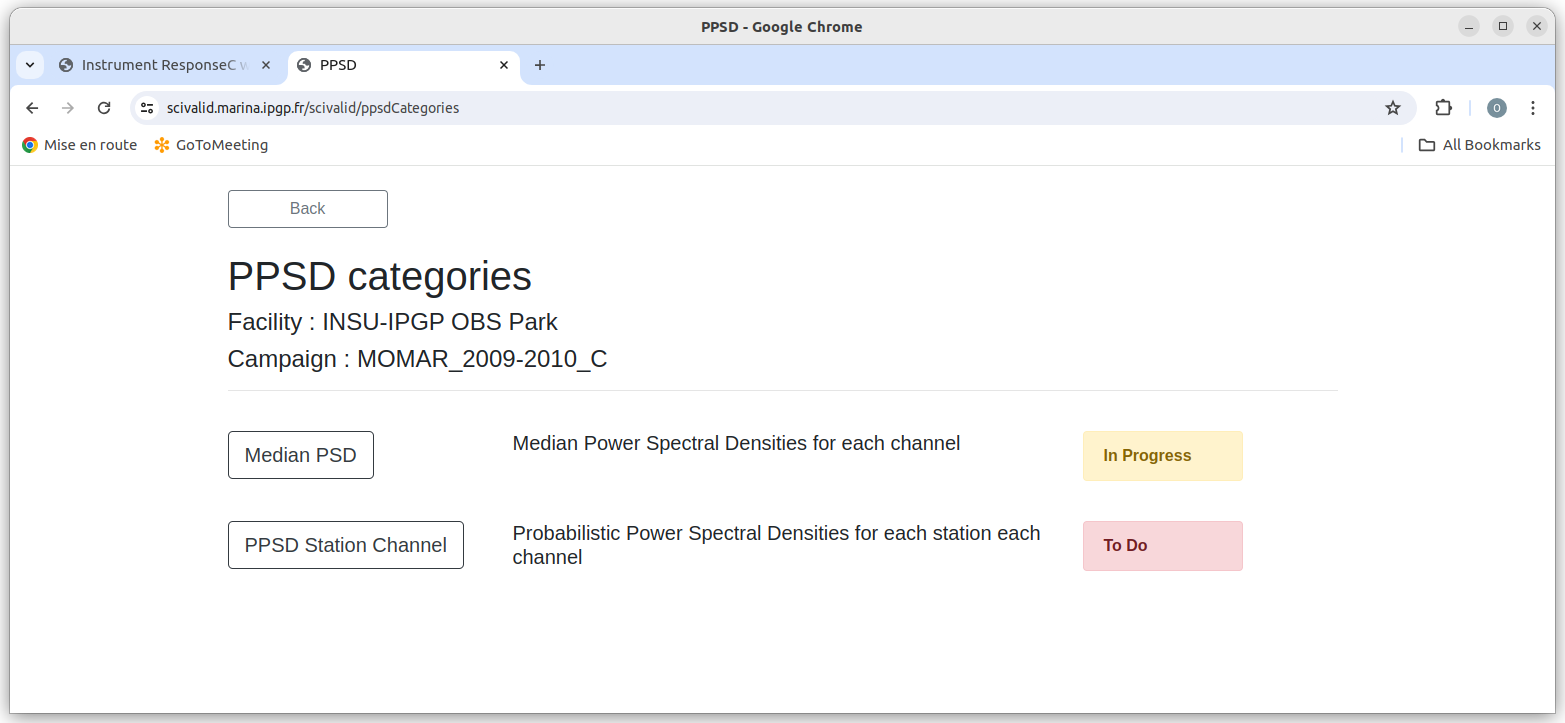
Fig. 3.2.2 PPSD categories
The PPSD Categories page (Fig. 3.2.2) allows the selection between the 2 categories of PPSD plots.
3.2.3. Median PSDs by Channel
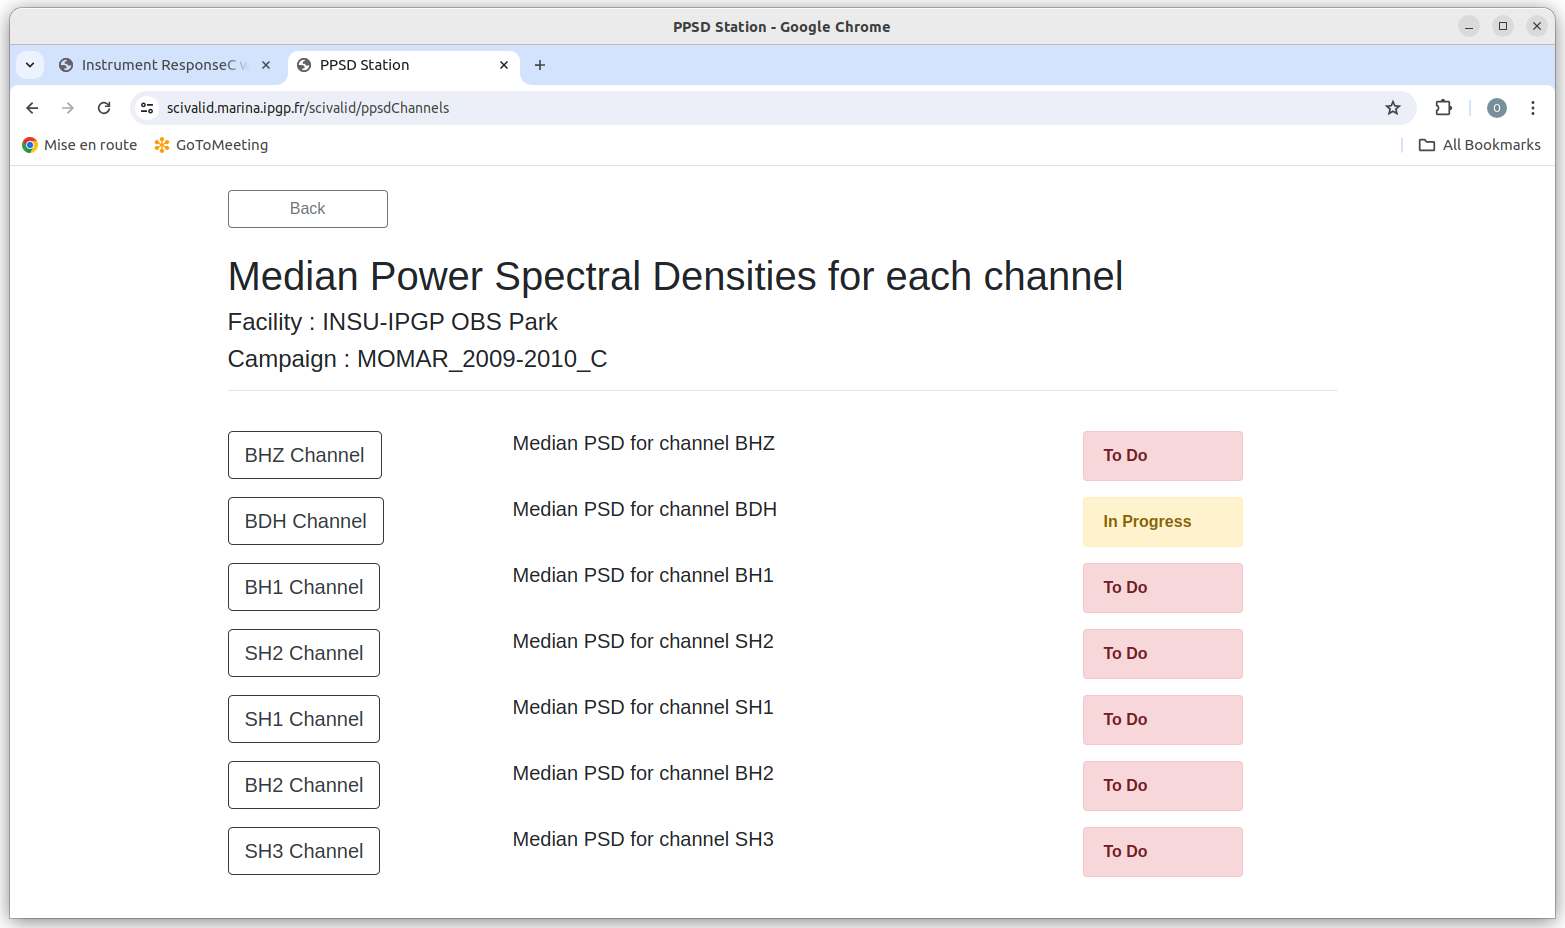
Fig. 3.2.3 Median PSD
Comparative PSDs for all unique channel names are reached through this page (Fig. 3.2.3 )
3.2.4. Example of Median PSD Image page
In the example below, three instruments have similar PSDs and two have abnormal PSDs. The latter two (LSVCC:BDH and LSVSC:BDH) are probably bad. If one of the channels had a similar form to the three “good” channels but different amplitudes, it could signal a bad instrument response, which should be repairable by the Facility.
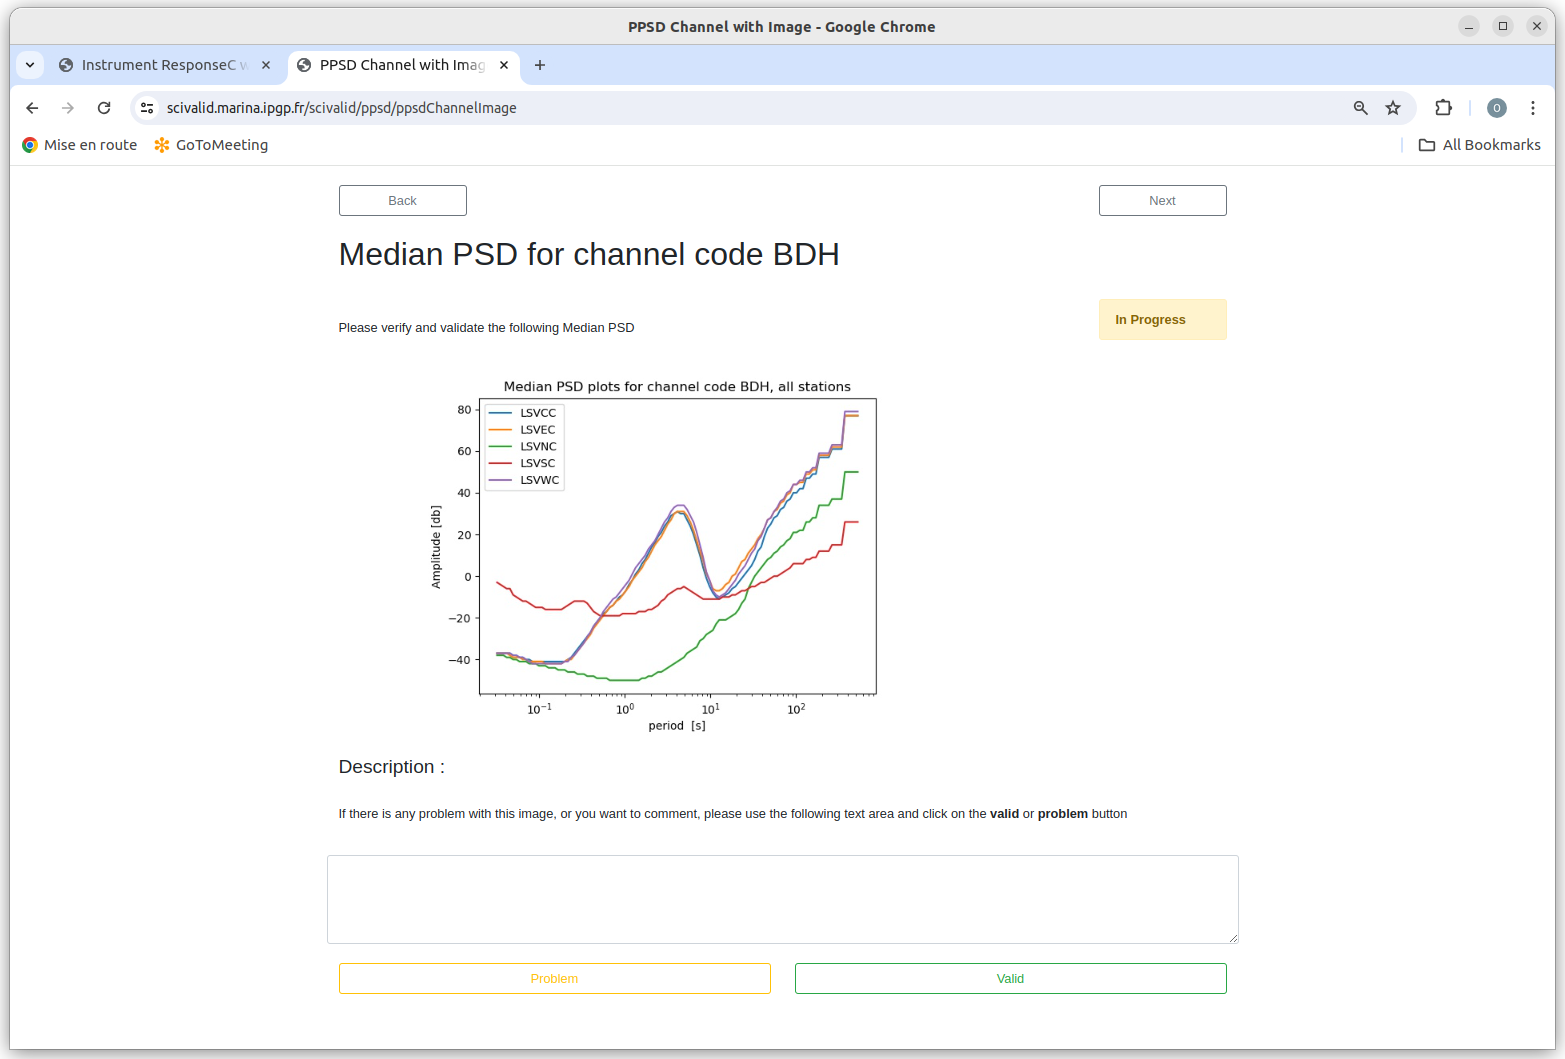
Fig. 3.2.4 Median PSD image page example
3.2.5. Station Channel PPSD
This page gives access to Probabilistic Power Spectral Densities of each channel of each station. These plots are useful for identifying periodic instrument problems or changes in the instrument response/health over time.
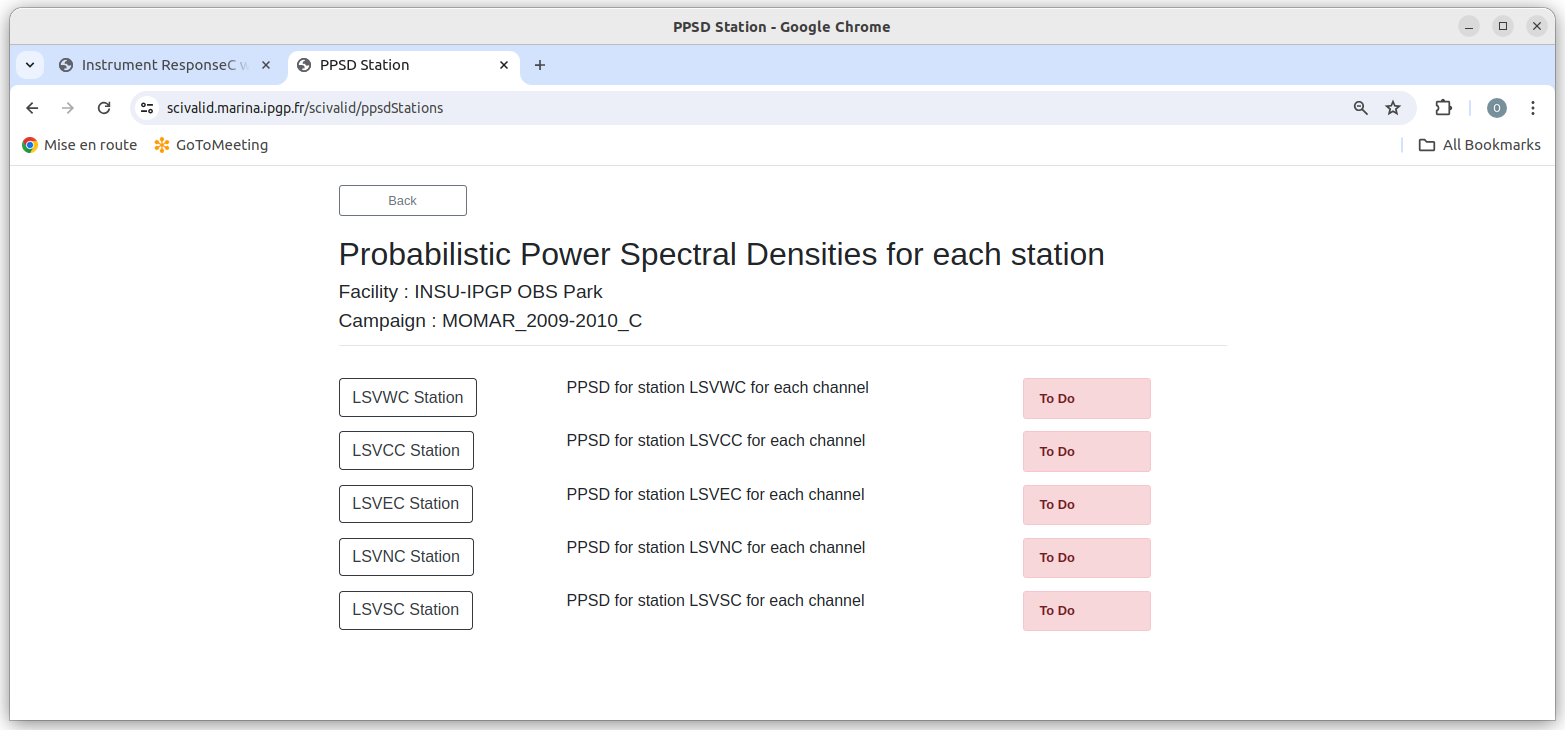
Fig. 3.2.5 PPSD for each station
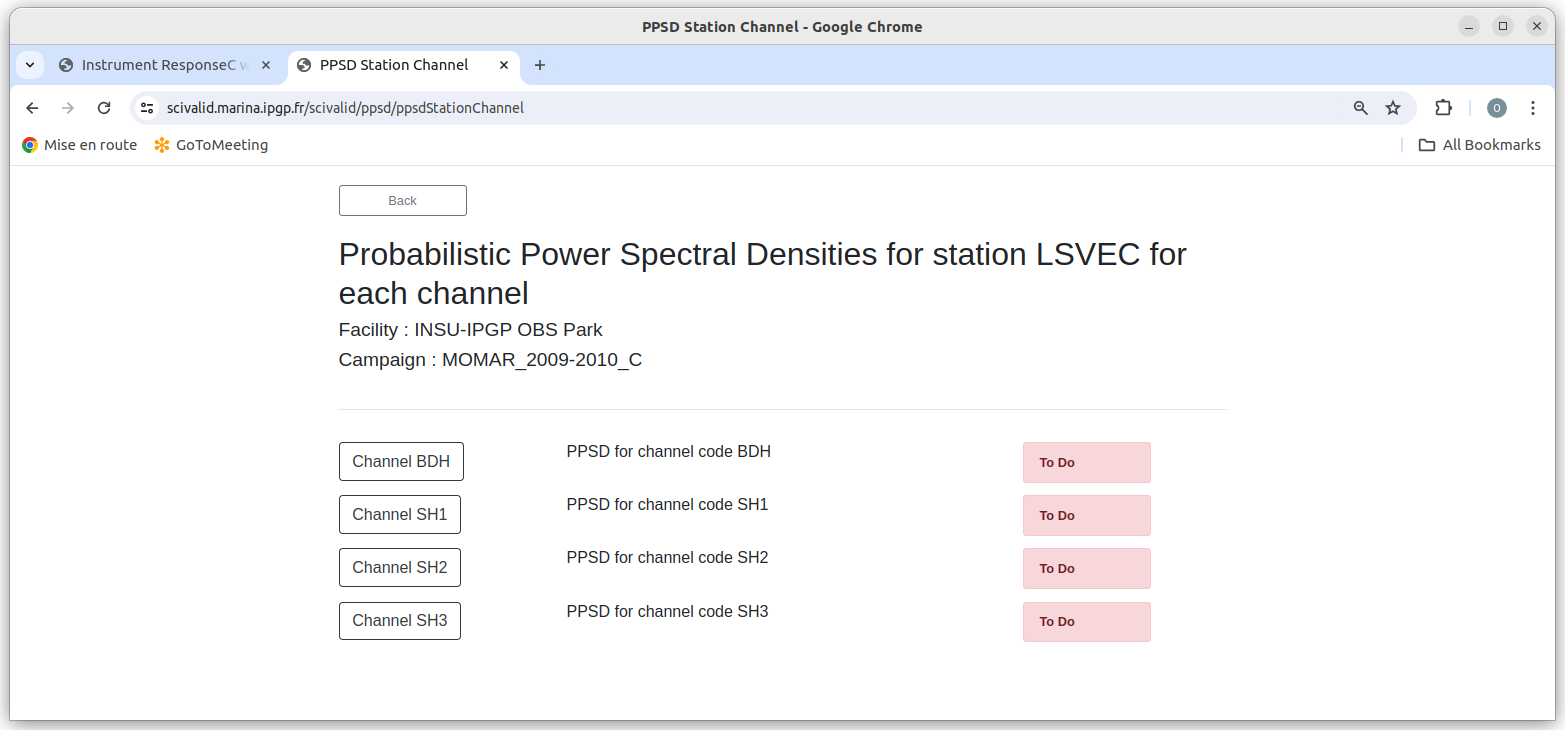
Fig. 3.2.6 PPSD for each station channel
Clicking on a station provides access to PPSDs for each of its channels.
3.2.6. Example of station Channel PPSD image page
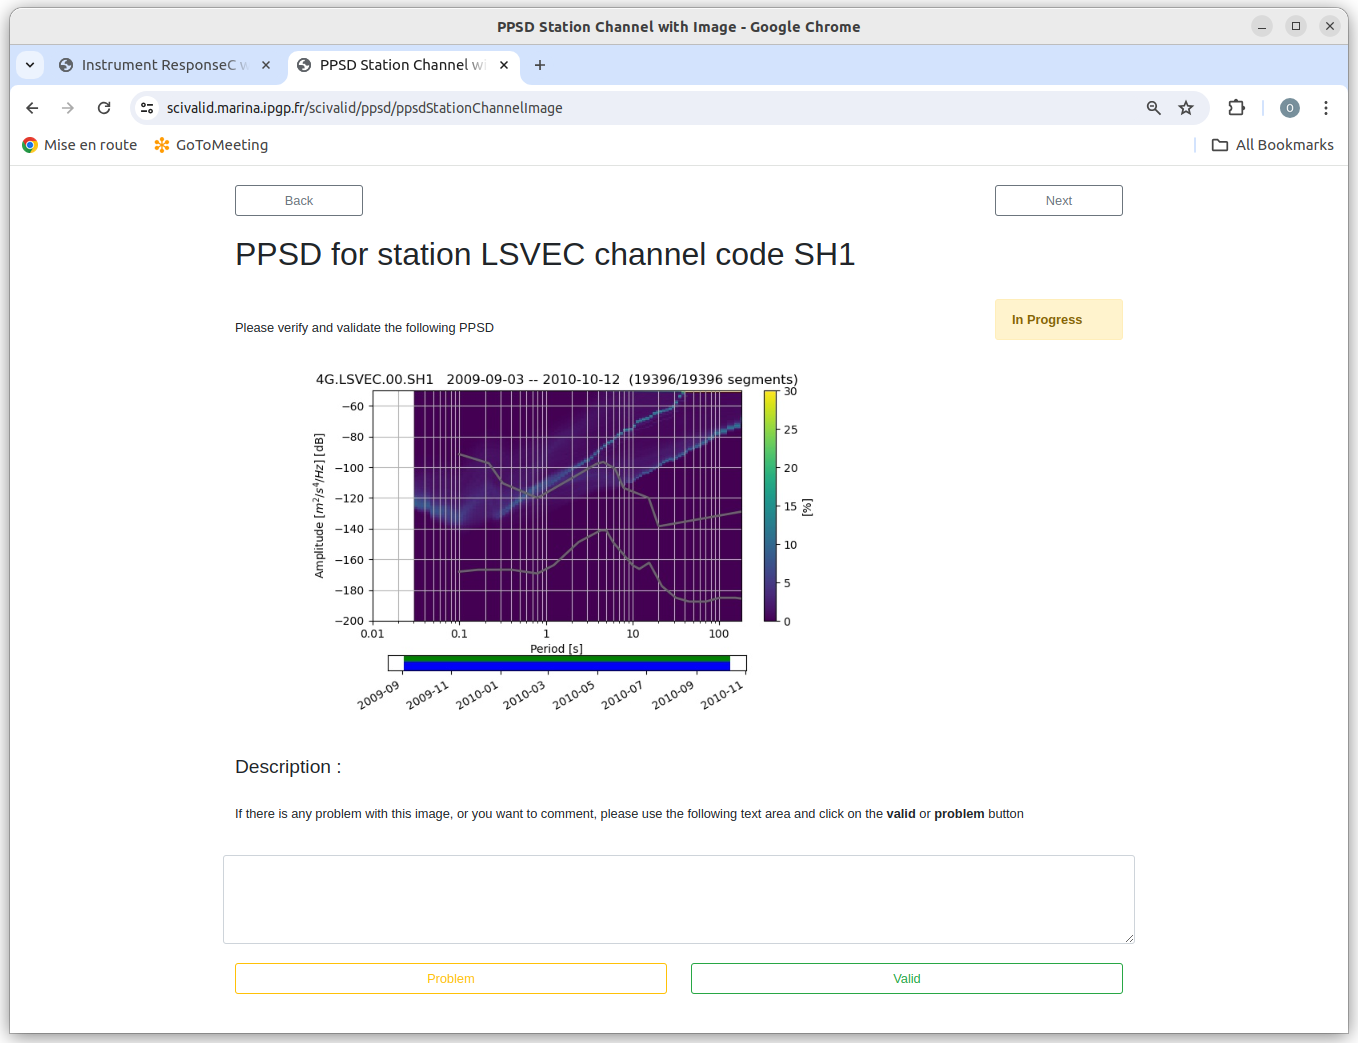
Fig. 3.2.7 Example of a PPSD station-channel image page
The PPSD plot shows the probability of the spectral energy being at a given level, for each frequency. In this plot, we can see that the instrument shows a bi-modal behavior at periods greater than 1 s. The higher level state corresponds to windows containing a write of data to the instruments hard disk. The duration of this write is relatively short (20-30 seconds) but it’s energy is high enough to affect the approximately 30-minute spectral window. This is not fixable in the data, but it could be used to indicate to the park that they should work on reducing parasitic noise during disk drive writes.
3.2.7. Waveform categories
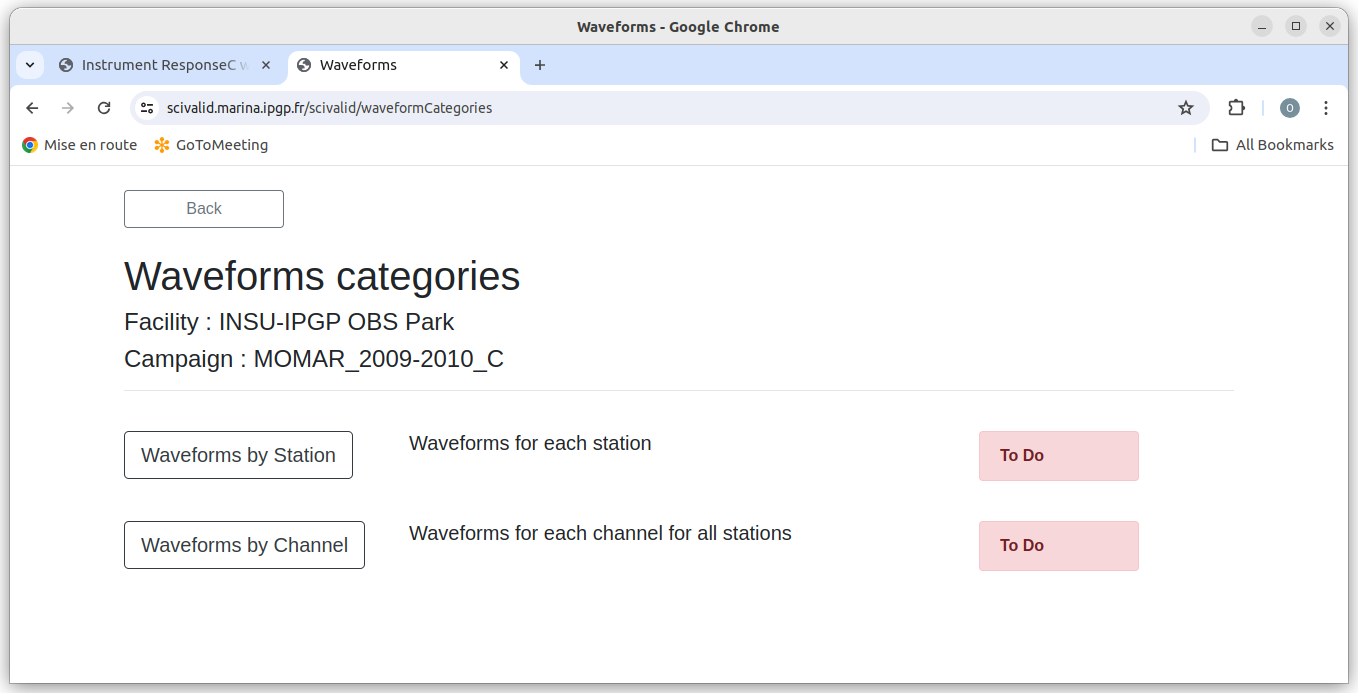
Fig. 3.2.8 Waveforms categories
From the page shown in figure Fig. 3.2.8, an auditor can select Waveforms by Station or Waveforms by Channel button.
3.2.8. Validation Events page
Waveform windows allow the auditor to look at real data, ideally from a known seismic event. The entry page lists the events specified in the experiment metadata file.
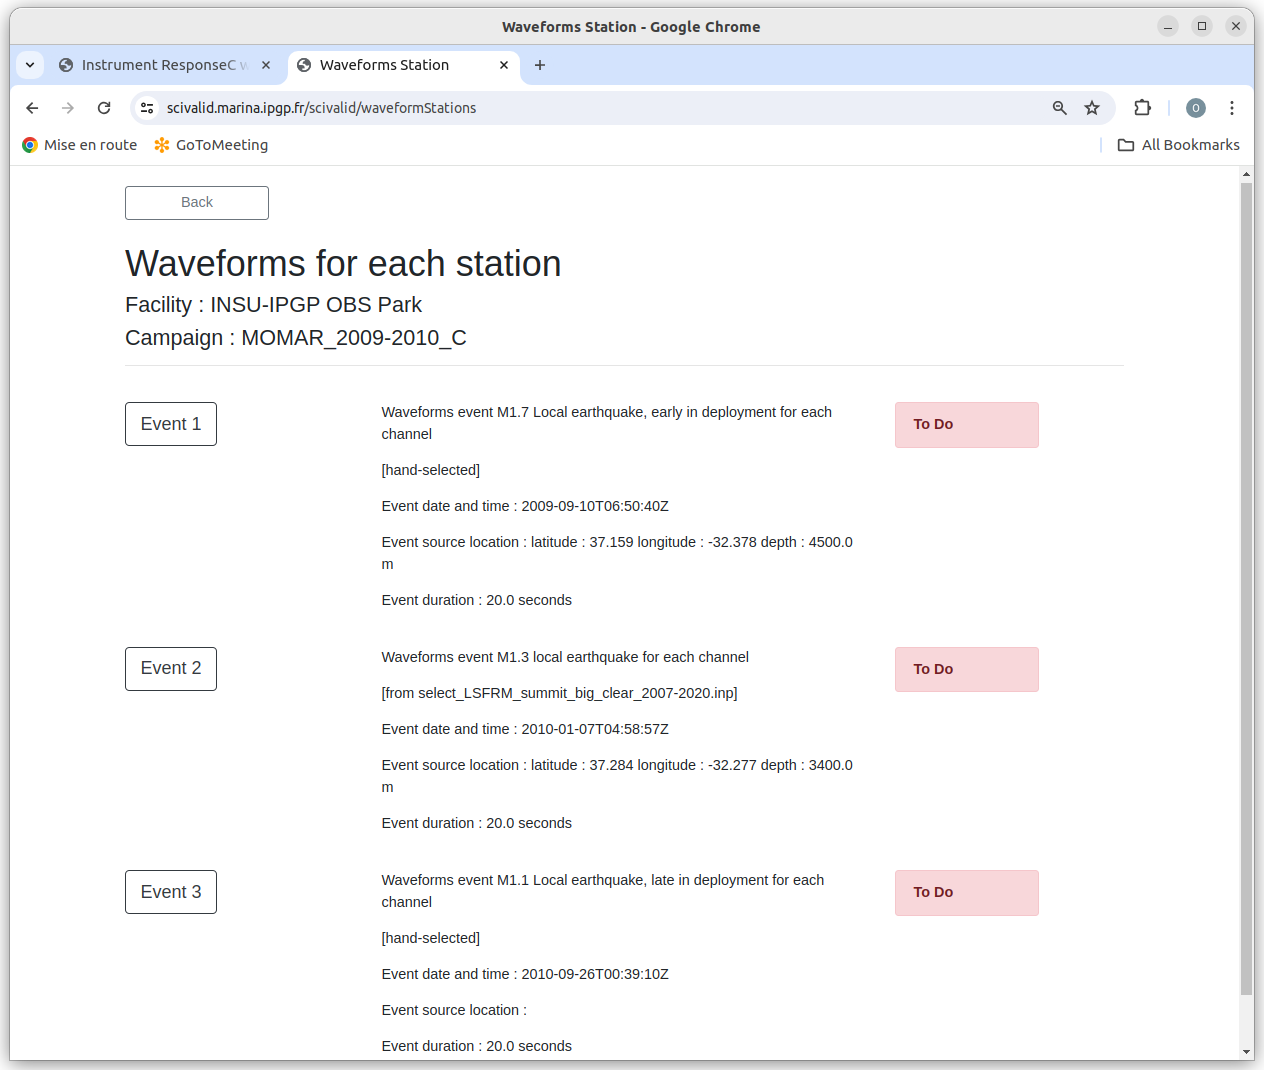
Fig. 3.2.9 Example of events for waveforms by Station
The figure Fig. 3.2.9 shows 3 events used for validation.
3.2.9. Examples of waveform image pages
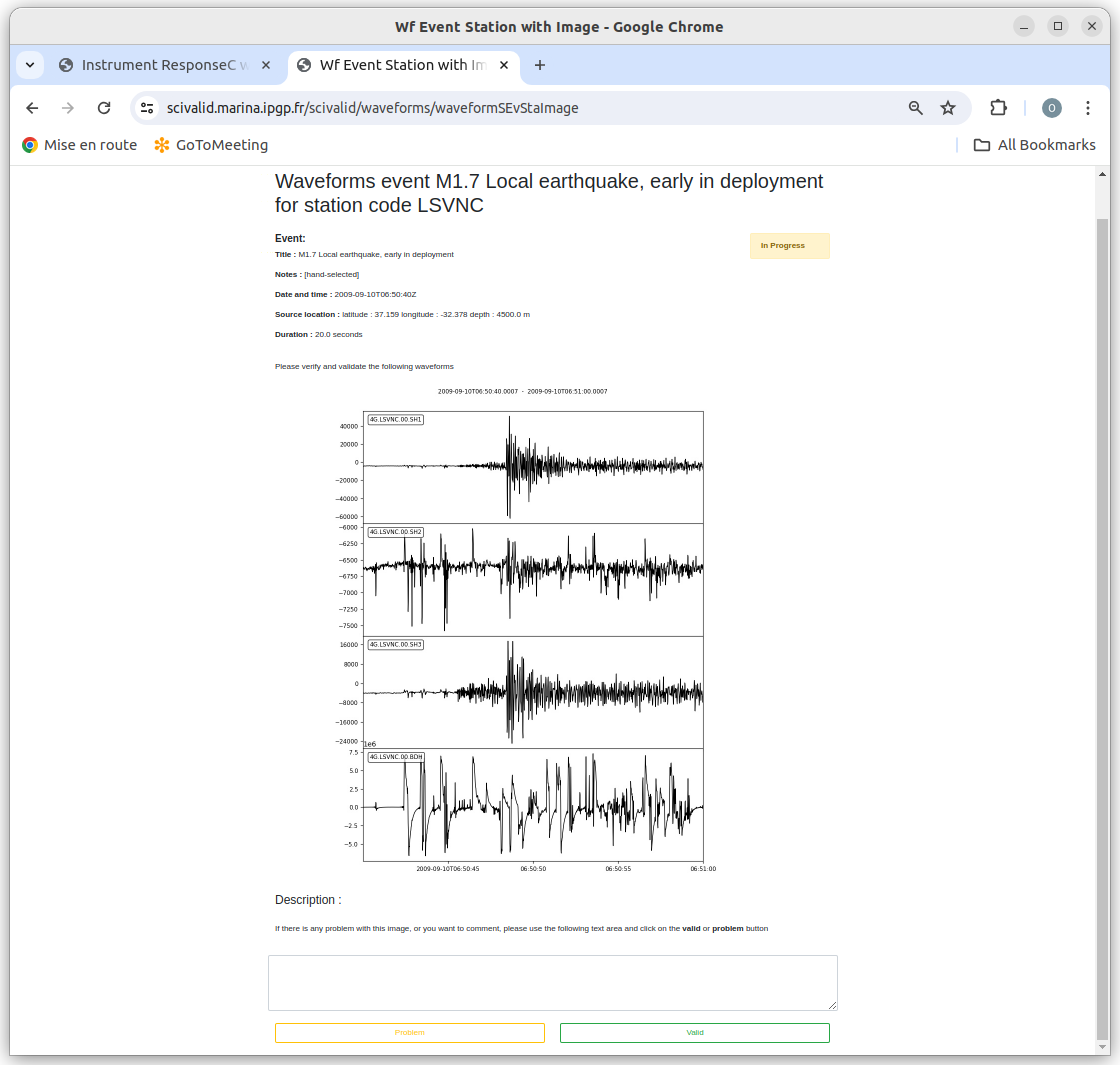
Fig. 3.2.10 Example of waveform by station image page
This page shows one event recorded by all channels on one station. We can see that two of the channels have some problem: SH2 has a lot of extraneous high frequency noise and BDH has low frequency noise. These are probably not fixable, but it is useful to note them so that the summary page can help the seismologists who will process this data.
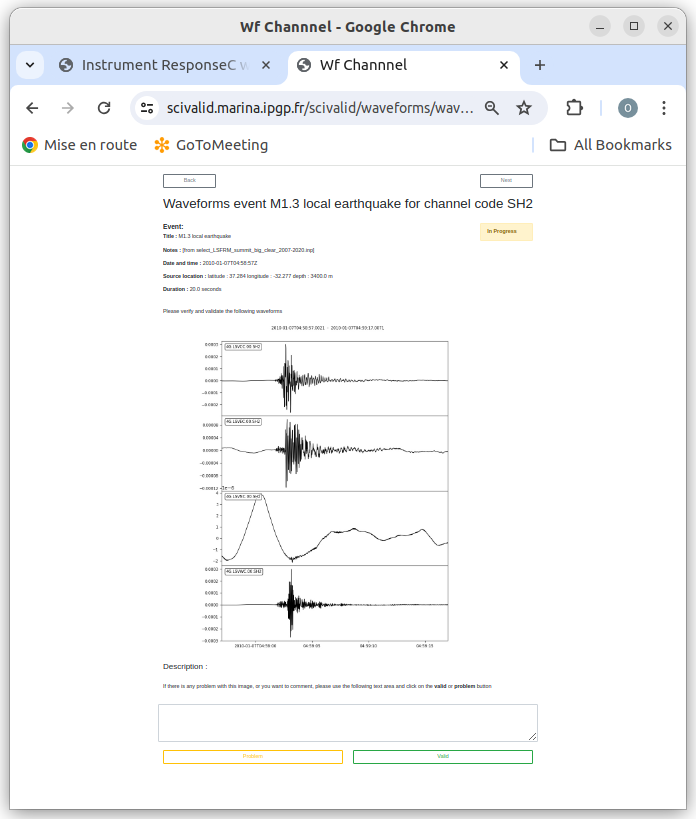
Fig. 3.2.11 Example of waveform by channel image page
This page shows one event recorded by the SH2 channels on all stations. We can see that the LSVSC station has much more low frequency noise than the other station, but the signal level is comparable. This could be because of localized currents, or because the LSVSC station is lacking a low frequency cutoff filter.