2. Technical web validation
2.1. Tree structure of technical validation
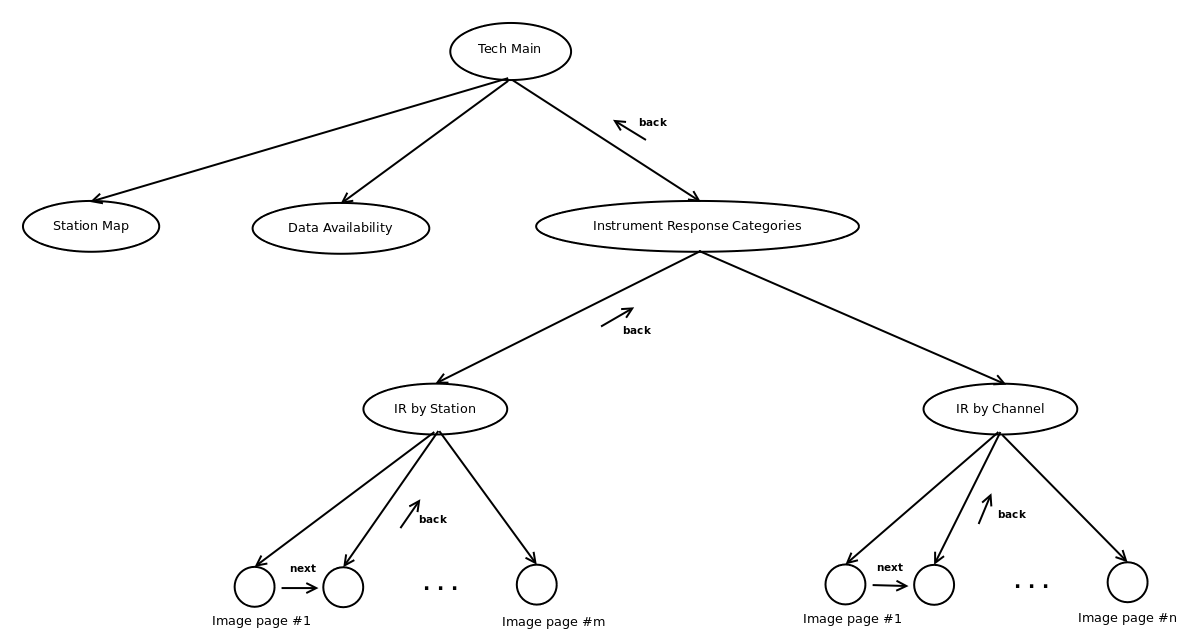
Fig. 2.1.1 Technical validation tree structure
The technical validation is structured as shown in figure Fig. 2.1.1. There is only one level of station map and data availability pages, but for instrument response, the navigativon will go through the Instrument Response (IR) page, followed by IR by Channel or IR by Station node pages. The IR by Station node page allows an auditor to access all IR by station images (for m stations, there will be m image pages, each with the IR of all channels on that station). An auditor starts with an IR image for the fisrt station, evaluate this image and then go to the next one, until all m stations have been evaluated. IR by Channel loops through all unique channel names (BH1, SH1, DDH, …), with each page displaying the IR for all channels with the same name.
2.2. Example of technical validation pages
2.2.1. Main page
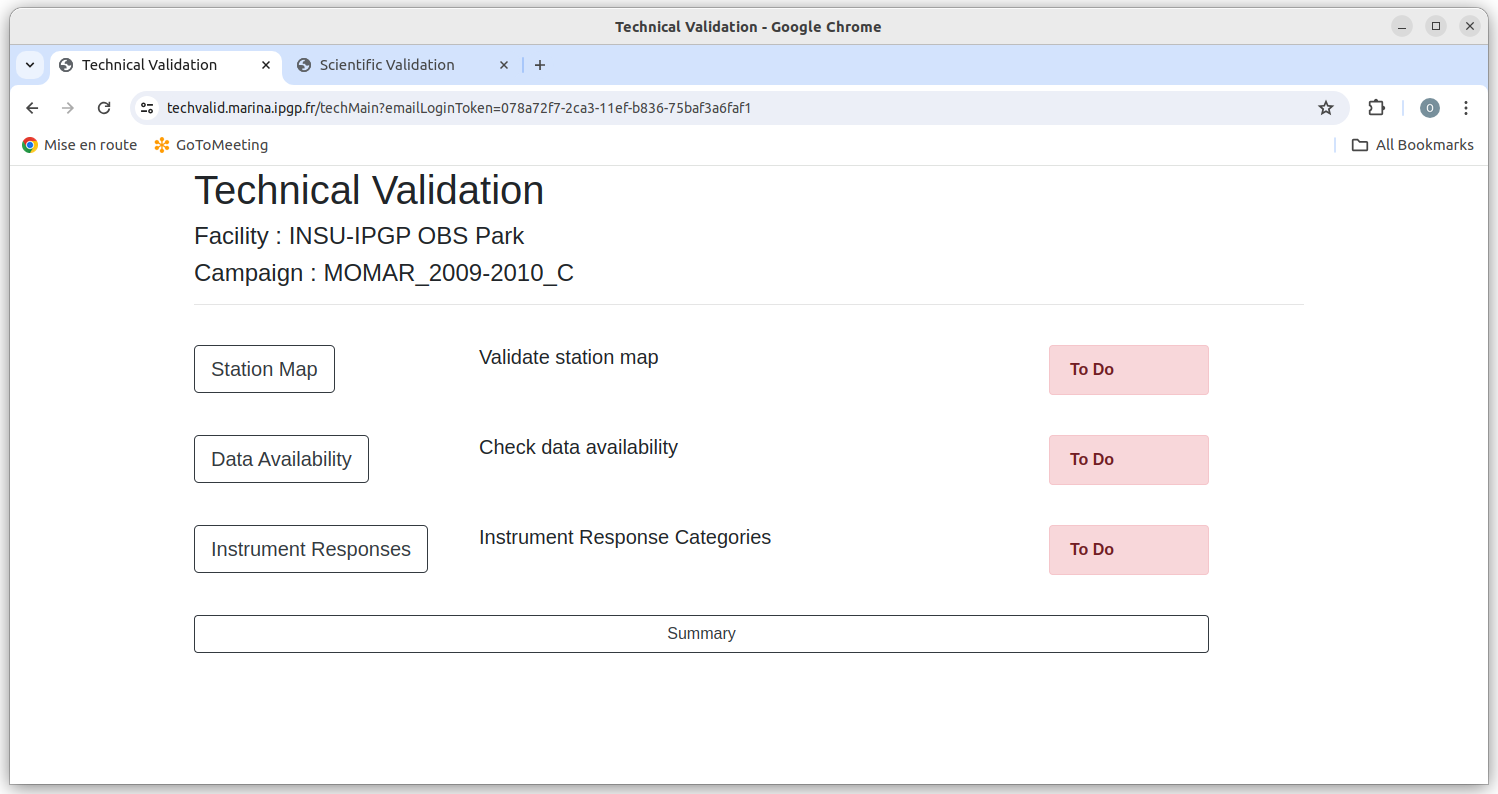
Fig. 2.2.1 Main page of technical validation
The technical main page shows the three categories of images to be validated, with the state of work progress in the right side of each category. If you click on Station Map button, you will move to the station map page (Fig. 4.1.1), and if you click on Data availability button, you will go to the data availability page (Fig. 4.2.1). If you click on click on the Instrument Responses button, you will move to the Instrument Response Categories page (Fig. 2.2.2). The summary button sends you to the Summary Page.
2.2.2. Instrument Response Categories page
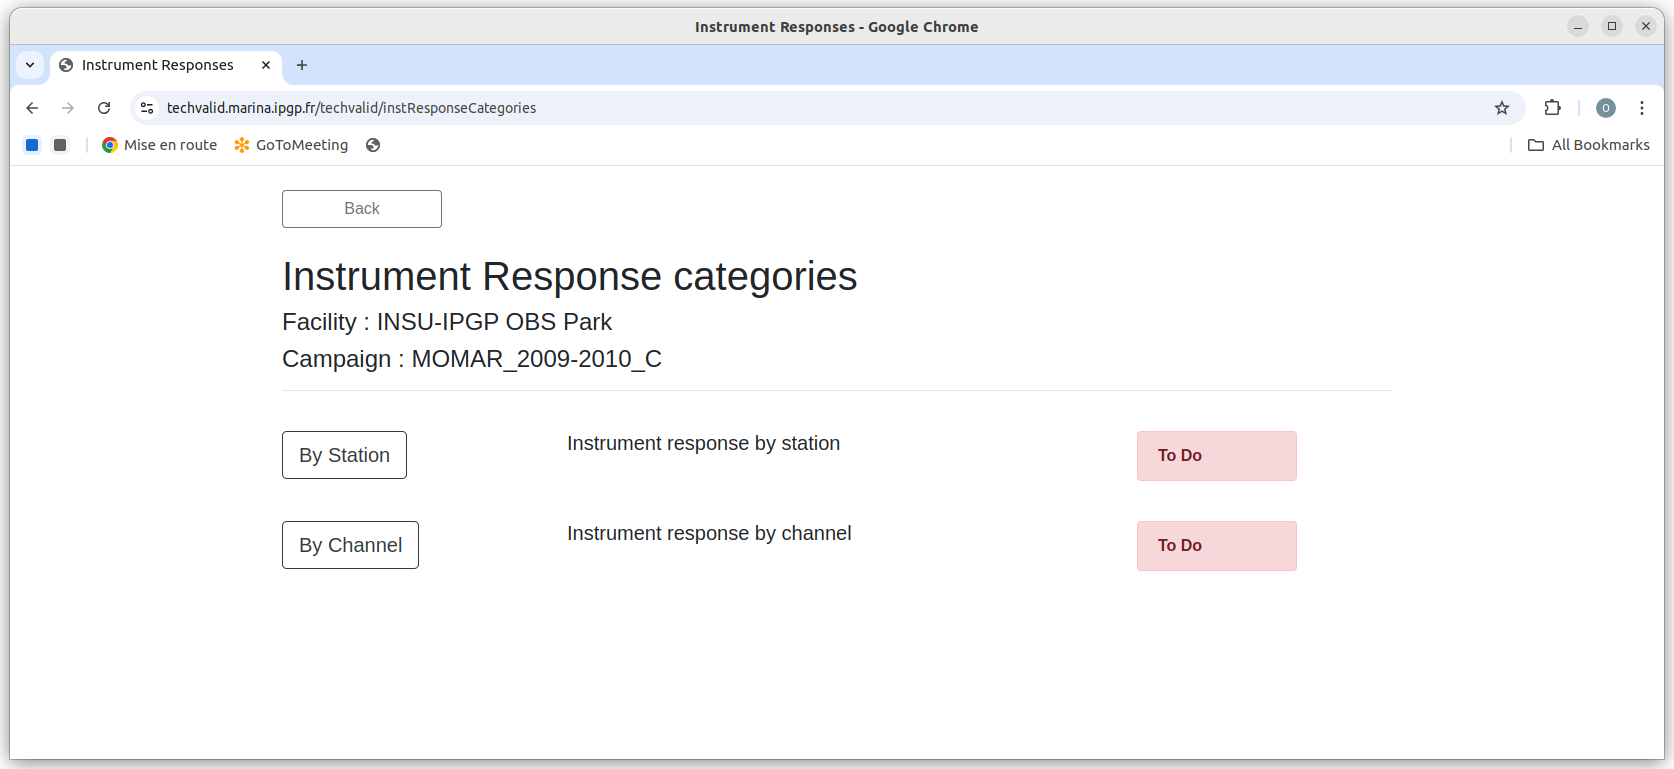
Fig. 2.2.2 Page of Instrument Response Categories
Click on the By Station button to start the Instrument Response by Station, and click on the By Channel button to start the Instrument Response by Channel.
2.2.3. Instrumet Response by station page
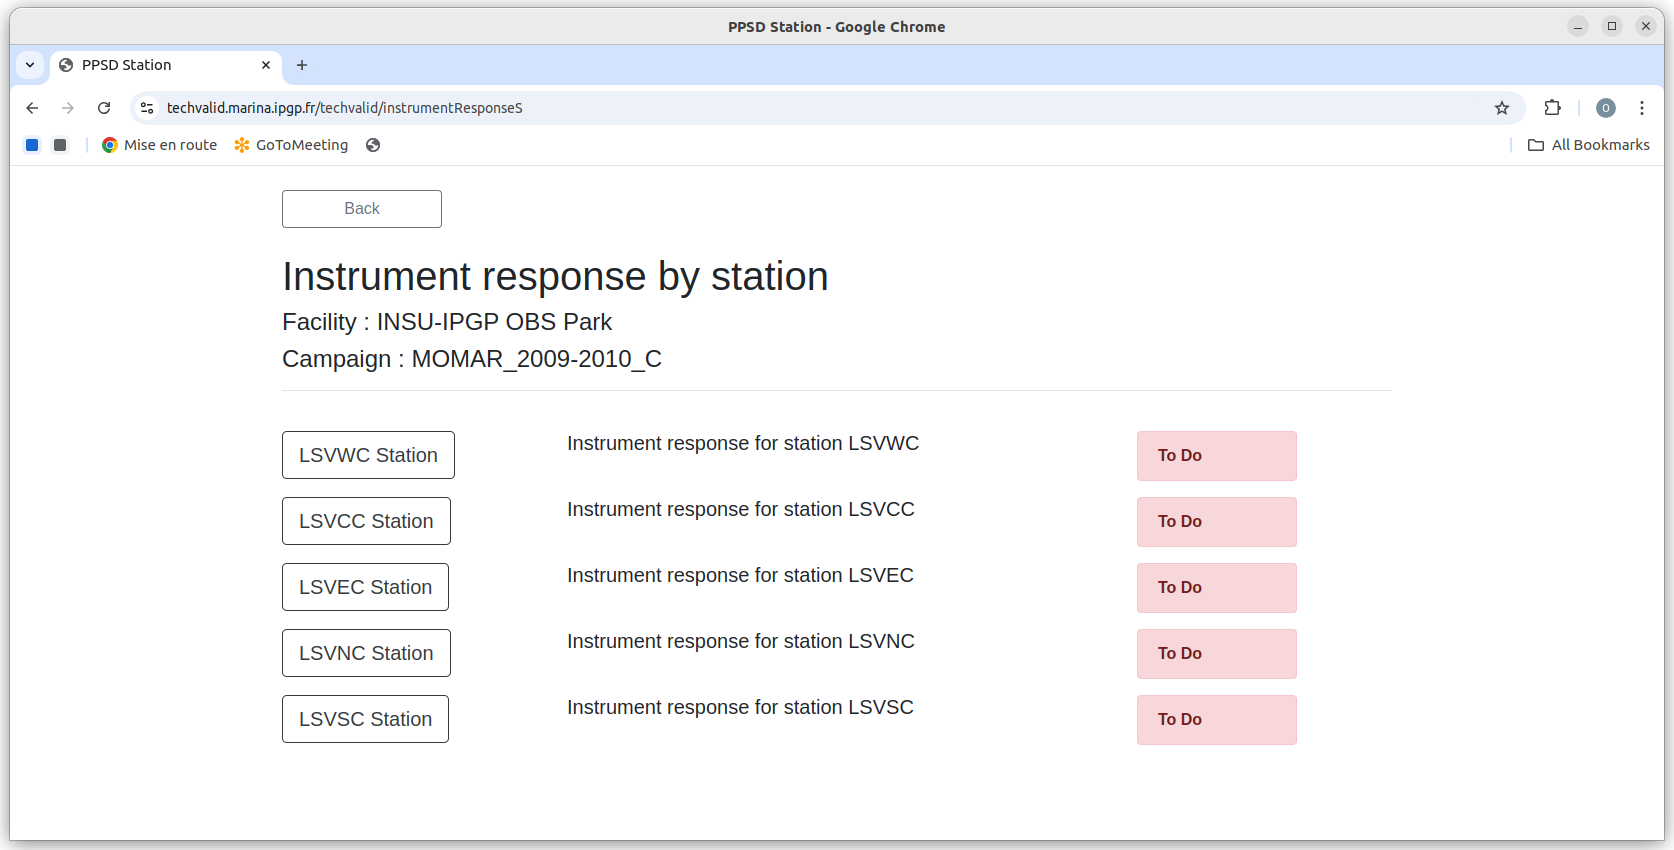
Fig. 2.2.3 Instrument Response by Station
This page allows an auditor to visit IR by station pages: in the figure Fig. 2.2.3 there are 5 stations, named LSVCC, LSVEC, LSVNC, LSVSC and LSVWC. This auditor opens an IR by station image page, by clicking on one of station name buttons. For example, if he/she click on the LSVCC button, a page with the IR plot for the station LSVCC will be displayed (figure Fig. 2.2.4).
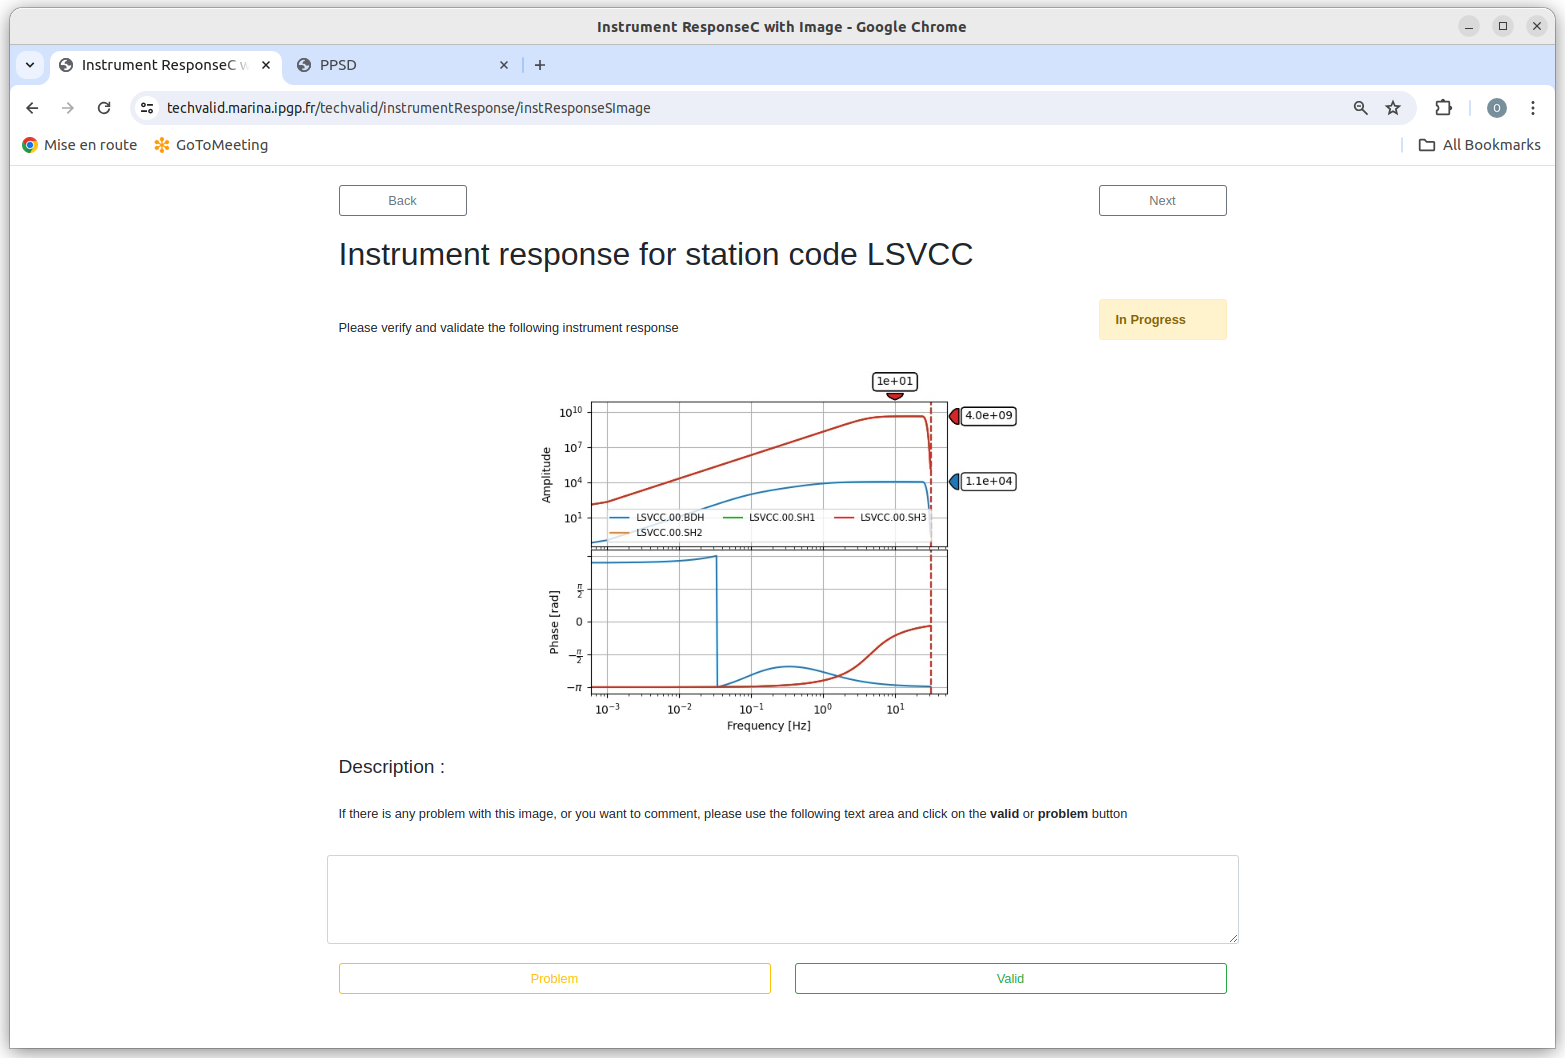
Fig. 2.2.4 IR plot by Station
See section Image page for more information on how to validate and move from one page to another.
2.2.4. Instrument Response by Channel page
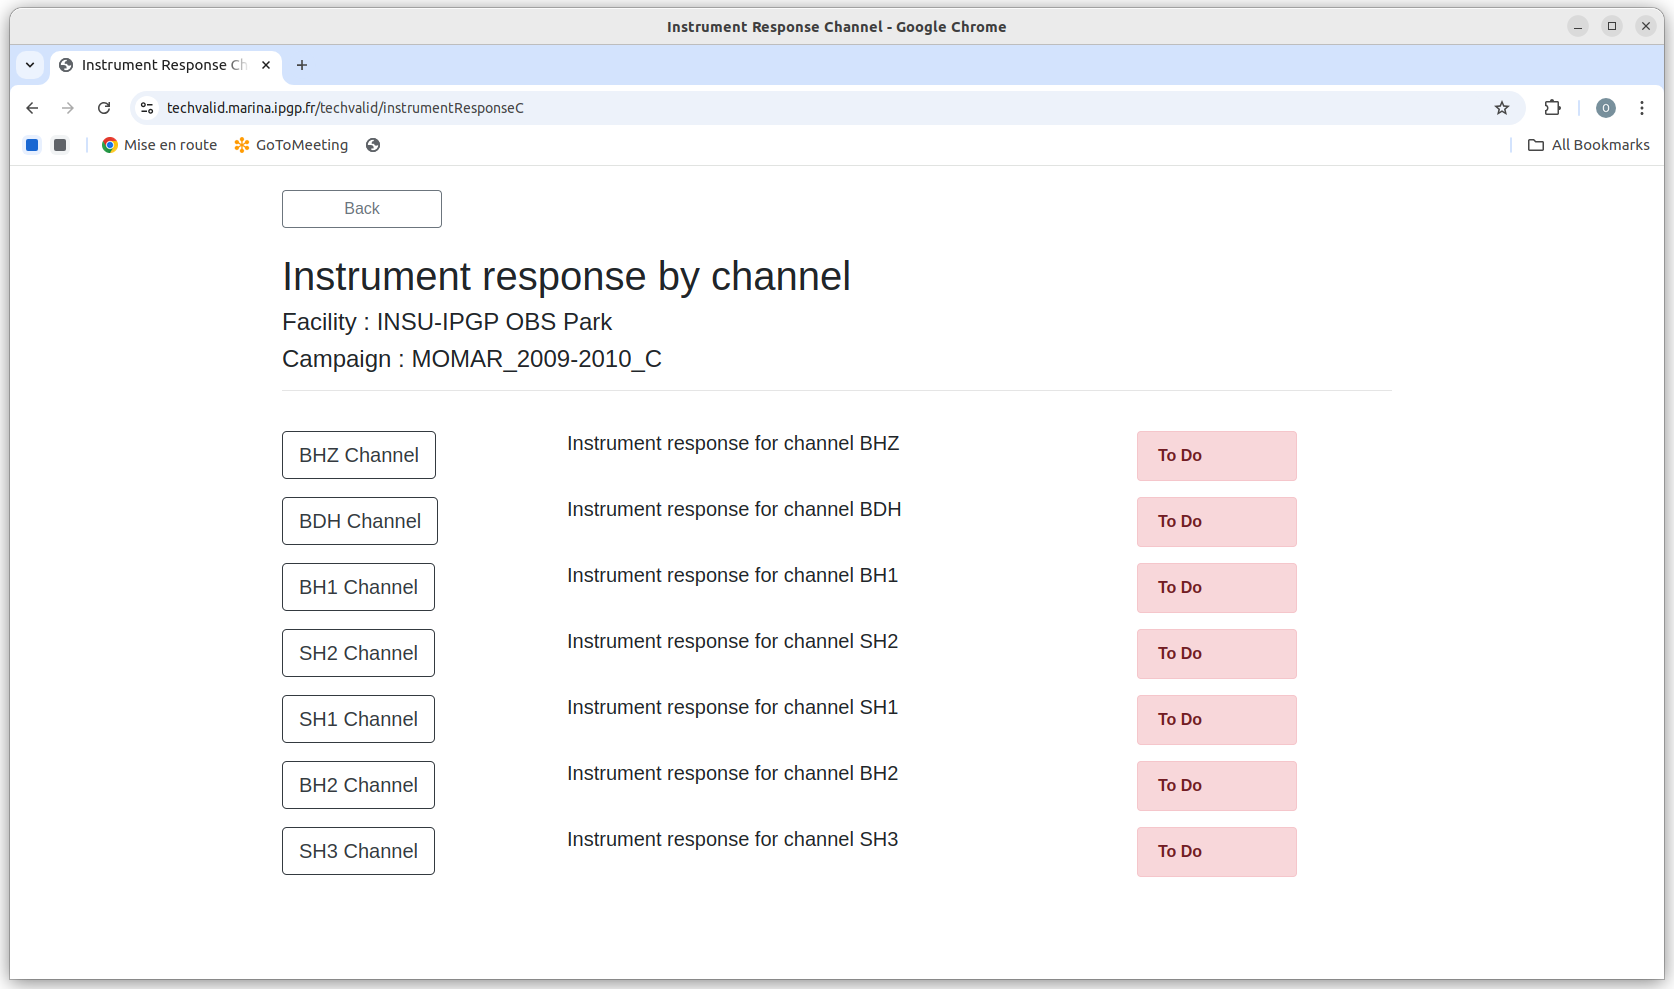
Fig. 2.2.5 Instrument Response by Channel
There is one button for each unique channel name in the dataset: for example, figure Fig. 5.2.6 shows 7 unique channels (BHZ, BH1, BH2, BDH, SH1, SH2, SH3). There is one button for each unique channel name in the dataset: for example, figure Fig. 2.2.5 shows 7 unique channels (BHZ, BH1, BH2, BDH, SH1, SH2, SH3). By clicking on the SH2 channel button, the image page for the instrument response for all SH2 channels (figure Fig. 2.2.6) appears. As is often (but not always) the case, all of the stations have the same response, because they all use the same instrument (sensor+amplifier+digitizer) for this channel name.
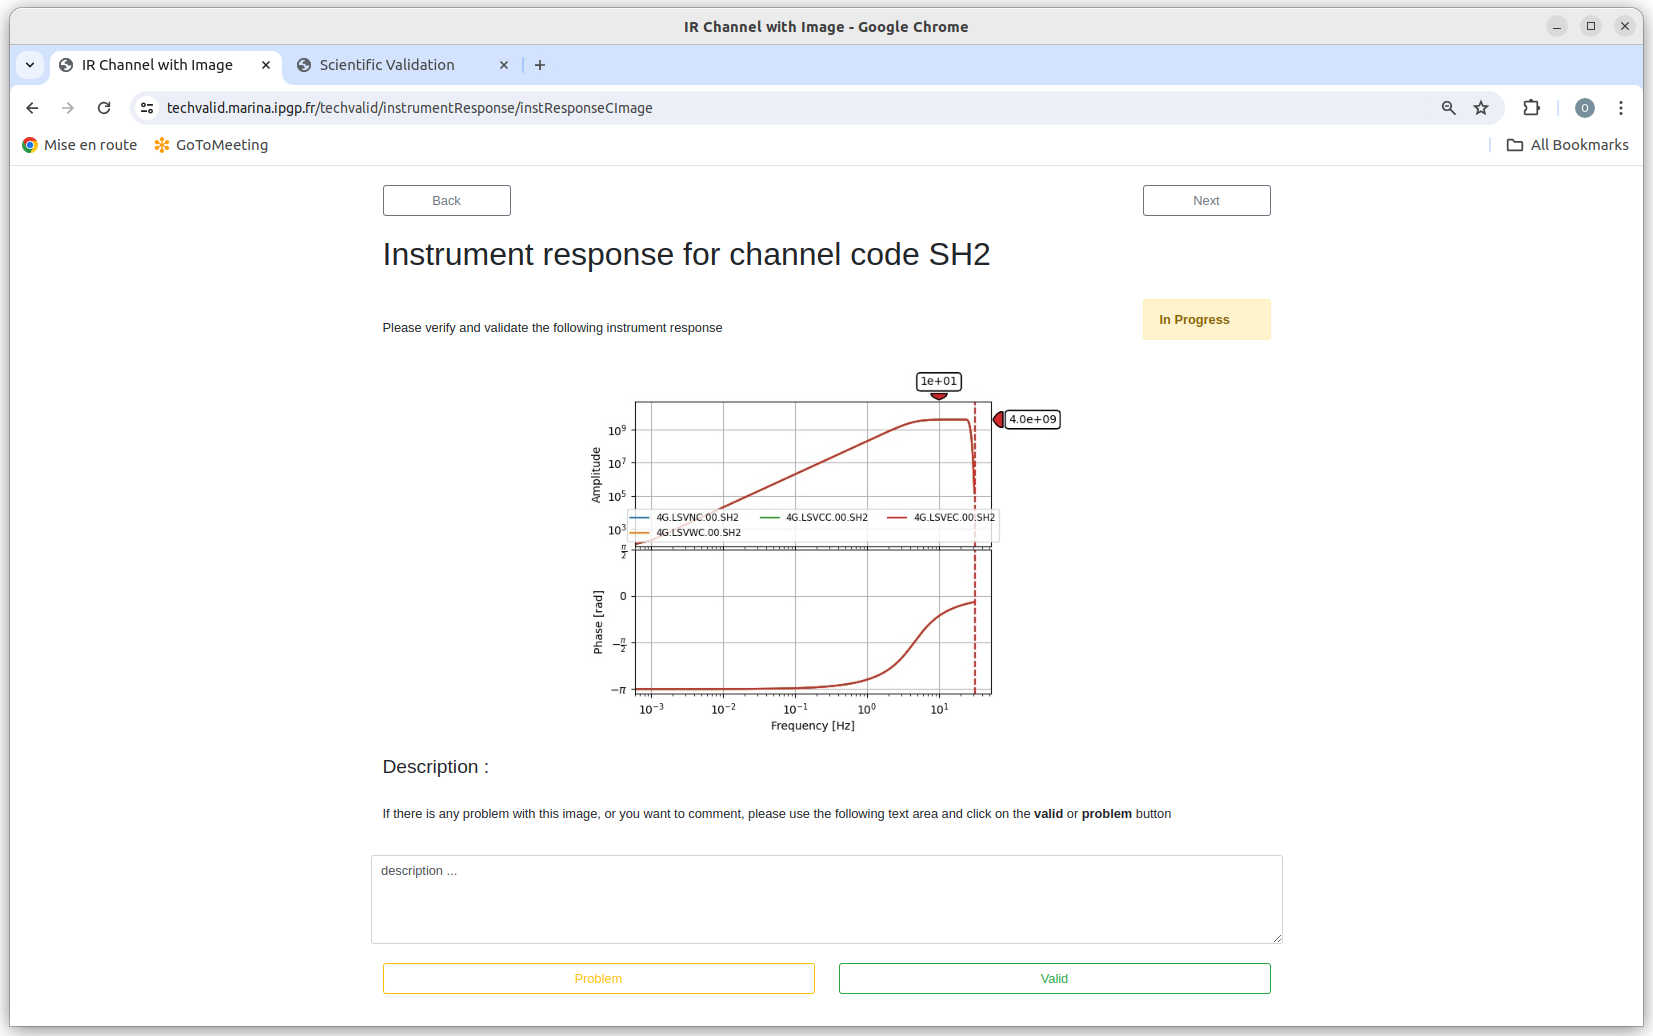
Fig. 2.2.6 IR plot by Channel